pyOutputter
Calculation tools and measuring equipment are often able to save the data to text file. Those files can be imported in various application like MathCAD, matlab, Excel/LibreOffice Calc, or ReportLab for further processing. A quick preview is is rarely possible.
The solution
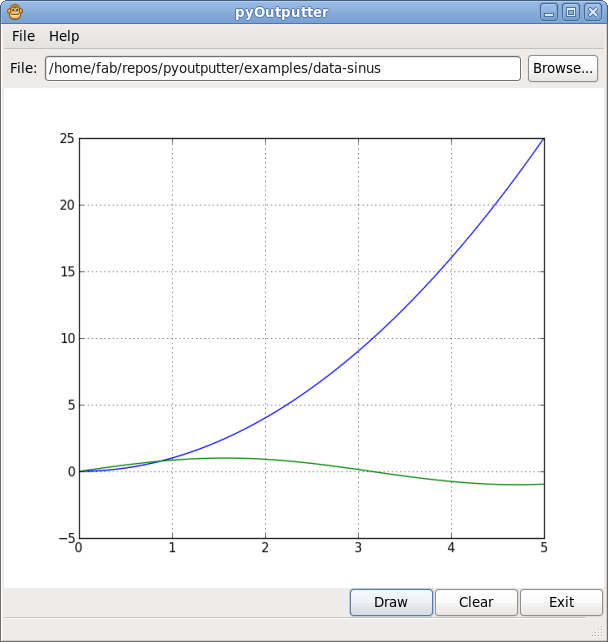
pyOutputter is able to print/display the data of any text based input file with two columns. The values are shown as two dimensional graph. The whole is python and pygtk based. matplotlib is required to plot the graph.
The out is simple saved as a temporary file and can be accessed.

pyOutputter is licensed under GPLv3+, for more details check COPYING.
The future
At the moment no further development of pyOutputter is planned. One of the next step will be to produce nicer graphs.